The Web Application ACMI on the Global Map

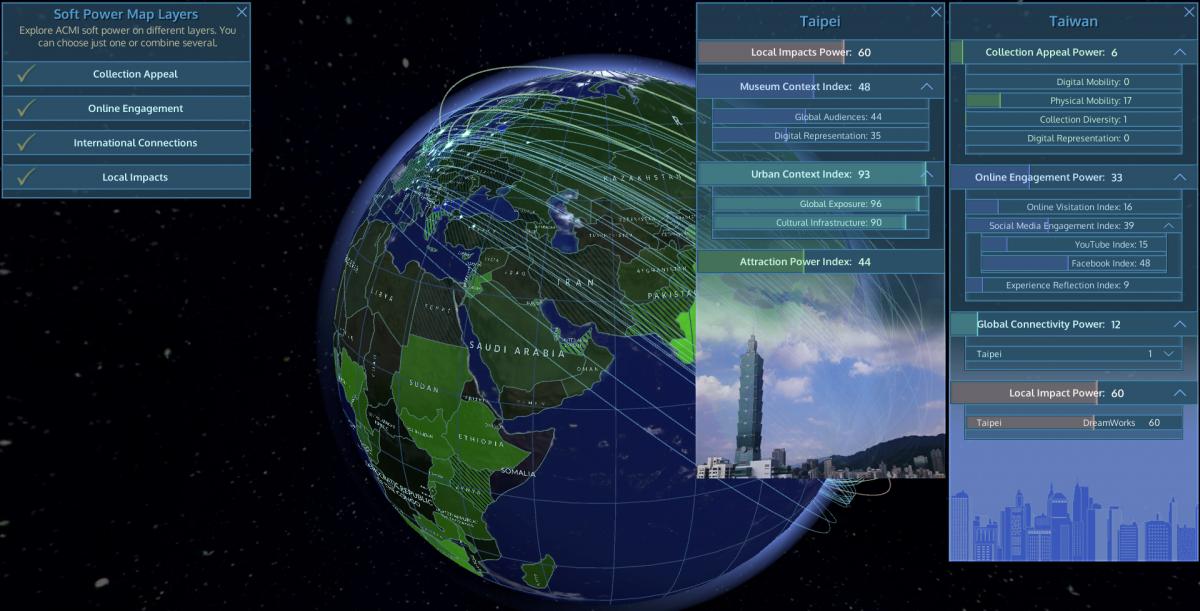
The web application ACMI Soft Power Map is a focused single-museum online tool to geo-visualise and assess the ACMI’s “attraction power” in Melbourne and abroad. It maps the ACMI’s collection appeal power, digital engagements and international connections in different countries around the world. This tool offers multilayered exploration of ACMI cultural resources and social outputs to reveal social-demographic, cultural and economic factors that affect its capacity to attract larger visitation and revenue.
Layer 1: Collection Appeal Power Index
ACMI has around 200 thousand original items in its collection, 70% of which are produced outside of Australia. A majority of those items were produced in the USA and the UK, however, there are also many items that have originated from countries all around the world including France, Germany, Japan, China, New Zealand, as well as many others. Additionally, ACMI’s collections are quite linguistically diverse. There are films in approximately 50 different languages which are spoken in more than 230 countries across the globe. The Collection Appeal Power Index is the first layer and measures the soft power of these items. The Collection Appeal Power Index ranges from 0 to 100 and is visualised on the digital map by the intensity of the green colour. This layer also identifies the linguistic diversity and scope of ACMI collections, highlighting the geographic areas of their origins. The Collection Appeal Power Index is calculated by combining two types of key variables. The first variable covers the basic cultural specifications of the films, which include the country of production, language and cultural content. The second variable draws on Melbourne’s important social demographic data, such as immigration and tourism statistics, to determine the level of potential exposure of the collection to the city’s population. Also taken into account alongside these two key variables is internet penetration rate which points to the collections level of discoverability and access.
Layer 2: Online Engagement Power Index
The Online Engagement Power Index is the second layer and maps geographic diversity of ACMI global online audiences. The index ranges from 0 to 100 and is visualized on the map by the intensity of the blue colour. The mapping exposes size and density of online participants, followers, and subscribers of ACMI social networking spaces in various geographic areas. To measure these variables, the layer draws on the museum web site visitation records and social media statistics collected from Facebook and YouTube. As a leading national museum in Australia of digital arts and cinematography, ACMI is especially active on YouTube and engages its global audiences on two channels which are “ACMI” and “ACMI Collection.” The latter is specifically devoted to enabling global access to its rich and unique collections online. There are approximately 1500 YouTube videos posted across the two channels. Mapping ACMI YouTube audiences is based on the analysis of the geographic distribution statistics for each of them. Furthermore, the Online Engagement Power Index also draws on data collected from TripAdvisor, the global media space where international tourists rate cultural institutions according to their experiences.
Layer 3: Global Connectivity Power Index
The Global Connectivity Power Index is the third layer and maps ACMI’s international networks. Within these networks are ACMI’s collaborators and contacts who facilitate cross-cultural projects, curatorial and artistic exchanges, and many other activities. These partnerships are vital for ACMI to have an international impact and transcend cultural and geographic boundaries. ACMI has developed an extensive network of partners throughout the world from the Americas to the Asia-Pacific region. This layer of mapping visualizes the links between ACMI and its 185 institutional partners in the 80 cities where ACMI has been active. It also highlights geographic areas on the globe, where ACMI has created dedicated communities of like-minded individuals by revealing the quantity and strength of institutional connections in specific geographic locations. The quantity is reflected by the number of organisations ACMI has connections with while the strength of these connections is measured by the number of activities these organisations are involved in with ACMI.
Layer 4: Local Attraction Power Index
The Local Attraction Power Index is the fourth layer and it maps the traveling international exhibitions of ACMI to different hosting museums and cities around the world. Since 2012 two of the ACMI blockbusters, Game Masters and DreamWorks Animation, were hosted by 16 museums in a dozen countries across various continents. By mapping these international blockbusters this layer aims to identify crucial factors that affect the capacity of ACMI to attract international audiences and demonstrate how local environments in different cities shape ACMI global brand recognition. The mapping of this layer draws on a large amount of data and includes three types of key indicators: Urban Context, Museum Context and Attraction Power. Urban Context draws on multiple variables that reflect the level of local cultural infrastructure and global exposure. Museum Context reflects specific quantitative characteristics of a hosting institution, including its onsite visitation and online engagement. Attraction Power focuses on the visitation statistics of a particular exhibition during the hosting period which is usually around 12-16 weeks. This data represents the local perception of the blockbuster across a specific social demographic profile of the city population.

